 Loading... Please wait...
- Home
- Indicators for TradeStation
- High-Low Rolling Range Indicators for TradeStation
The high-low rolling range indicators are a set of indicators designed to identify the highest and lowest prices over a set number of bars and establish the trading range for the period. Using these indicators traders can easily identify where the market is trading relative to its longer term trading range.
Our high-low rolling range indicators can also be used to detect and alert when the market makes a new high or low or crossed the midpoint of the trading range and highlight bars where the market is trading near the top or bottom of the range.
The indicators can also be employed to scan multiple symbols in TradeStations RadarScreen or scanner.
In addition to the standard indicators the high-low rolling range indicators include an oscillator indicator to plot a sub graph of where the market is currently trading relative to the longer term trading range and a histogram indicator to display the range and volatility of the market.
Included within these indicators are multiple settings for customizing the indicators function and appearance and when to be alerted to potential trading opportunities.
100% Money Back Guarantee
You can try these indicators for 30 days risk free and evaluate them for yourself within TradeStation. If after purchasing these indicators you decide they are not right for you just let us know within 30 days for a full refund.
Screenshots
The screenshot below shows the high-low rolling range indicator applied to a TradeStation chart. In this example we are monitoring the market using the 20 bar trading range based upon the high and low price. As the market makes new 20 bar highs and lows the indicator changes color, and can provide alerts if desired. Additionally the indicator is set to paint the price bars yellow when the market is trading within the top 10% of the trading range and red when inside the bottom 10%.

In the AEE chart below the high-low rolling range has been set to identify the trading range over the last 21 bars and then to highlight bars based upon where the market has closed within that trading range by painting bars that have closed in the top half of the trading range yellow and bars that have closed in the bottom half red.
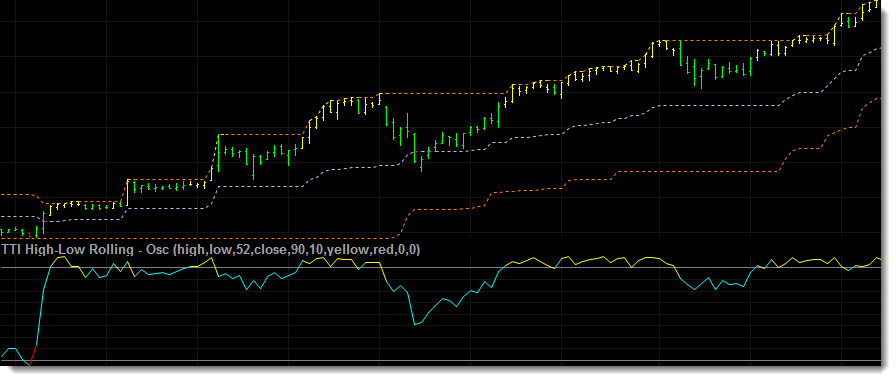
The next chart contains a weekly bar chart of AMZN in which the high-low rolling range indicator has been set to identify the range over 52 bars allowing traders to quickly and easily see how the market is performing against its 52 week trading range. The chart also includes the high-low rolling range oscillator which calculates and displays the markets current position relative to the high/low trading range.
The image below shows the sub graph version of the high-low rolling range indicator that displays the trading range, in this case the 100 bar trading range. As the trading range expands and makes a new relative high the indicator includes the option to highlights the range in yellow and when the range contracts making a new relative low the indicator can highlight the range in red alerting traders to an increase or decrease in volatility.

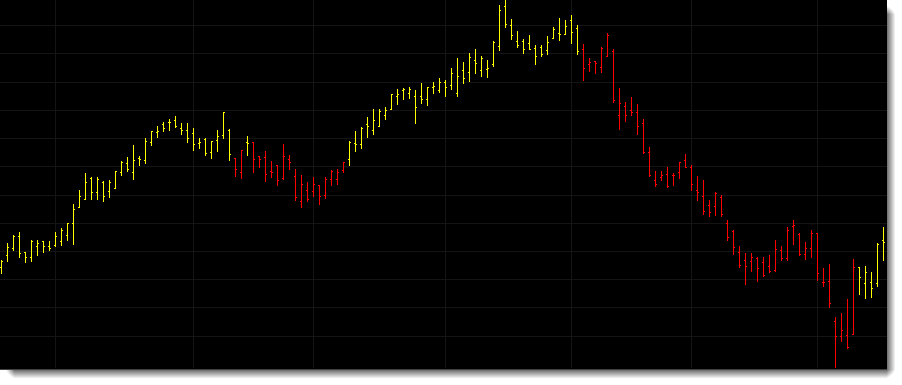
The indicator includes the option to set the prices you want to use when determining the trading range so you are not limited to using only the high and low. Traders can use the open or close or some other combination of prices. Or as in the example below use the closing price to set both the high and low of the trading range.

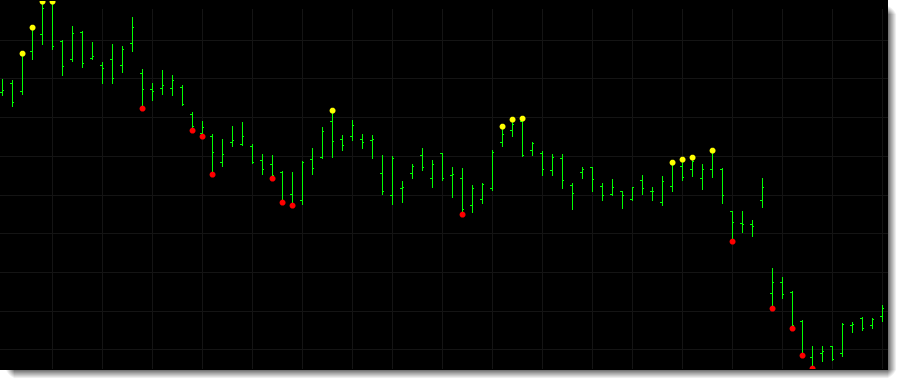
The final chart shows the high-low rolling range indicator applied to SBUX. In this example the indicator has been stripped back to simply show when the market makes a new 10 bar high or low as indicated by the yellow and red dots.
Additional Information
The high-low rolling range indicators include multiple settings for adjusting the period and style of the indicator.
When applied to RadarScreen the high-low rolling range indicator provides additional information.
- Pos - shows the current position of the market relative to the trading range. 0% means the market is at the low of the trading range while 100% means the market is at the high.
- High - displays the high of the period being monitored.
- High Count - shows how many bars it has been since a new high was made.
- Low - displays the low of the period being monitored.
- Low Count - shows how many bars it has been since a new low was made.
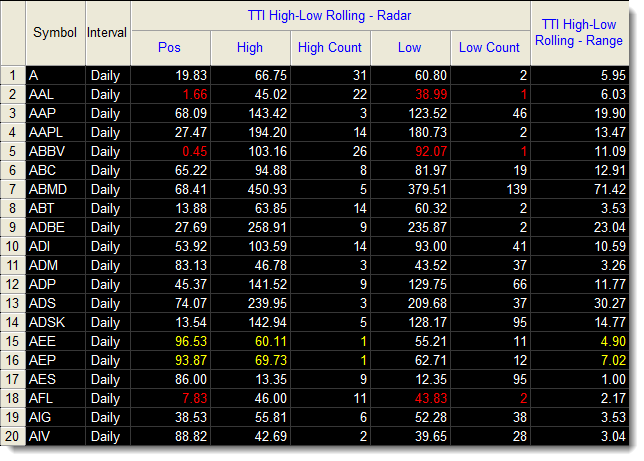
The high-low rolling range indicator applied to a RadarScreen.
Standard Indicator Features
- Various inputs and settings to help customize and optimize each indicator.
- Can be applied within TradeStation using various tools, including charts, RadarScreens and scanner.
- Option to use TradeStation sound, message and email alerts.
- Includes PDF manual.
Delivery
You should expect to receive your order within 1 working day via email.
| 100% Money Back Guarantee These TradeStation compatible indicators come with a 30 day money back guarantee. During the first 30 days after purchasing these indicators you can use and evaluate these indicators as much as you like. If after purchasing these indicators you decide they are not right for you just let us know within 30 days for a full refund. |
||
Continued Support and Updates for a Minimum of 12 Months
All our products include full support and updates for at least 1 year so if you have any problems or require any additional information you can contact us for assistance.
If you have any questions about this, or any other product we offer, please contact us.
Disclaimer
All information provided is for educational purposes only and it should not be assumed that the information presented will be profitable or that it will not result in losses.
You understand and acknowledge that there is a high degree of risk involved in trading securities and/or currencies. TechnicalTradingIndicators.com assume no responsibility or liability for your trading and investment results and you agree not to hold the company liable for any monetary loss and/or damages of any kind. There is a high degree of risk in trading and you should always consult a qualified advisor about the suitability of any investment.
HYPOTHETICAL OR SIMULATED PERFORMANCE RESULTS HAVE CERTAIN LIMITATIONS. UNLIKE AN ACTUAL PERFORMANCE RECORD, SIMULATED RESULTS DO NOT REPRESENT ACTUAL TRADING. ALSO, SINCE THE TRADES HAVE NOT BEEN EXECUTED, THE RESULTS MAY HAVE UNDER-OR-OVER COMPENSATED FOR THE IMPACT, IF ANY, OF CERTAIN MARKET FACTORS, SUCH AS LACK OF LIQUIDITY. SIMULATED TRADING PROGRAMS IN GENERAL ARE ALSO SUBJECT TO THE FACT THAT THEY ARE DESIGNED WITH THE BENEFIT OF HINDSIGHT. NO REPRESENTATION IS BEING MADE THAT ANY ACCOUNT WILL OR IS LIKELY TO ACHIEVE PROFIT OR LOSSES SIMILAR TO THOSE SHOWN
Tradestation Disclaimer:
“Neither TradeStation Technologies nor any of its affiliates has reviewed, certified, endorsed, approved, disapproved or recommended, and neither does or will review, certify, endorse, approve, disapprove or recommend, any trading software tool that is designed to be compatible with the TradeStation Open Platform.”
Read our full disclaimer plus terms and conditions here.
