 Loading... Please wait...
- Home
- Indicators for TradeStation
- Breakout Box Indicators for TradeStation
Special Offer
Save $50 when you purchase both our Darvas box and breakout box indicator sets together. Click here for details.
Breakout Box Indicators for TradeStation
The breakout box indicators identify areas of price consolidation, when the market typically trades within a narrow range. These indicators identify the upper and lower boundaries of such a price consolidation, the support and resistance levels, and form a box around it in anticipation of prices breaking out of the box.
Breakout traders can use the breakout box indicators to identify markets which have consolidated for an extended period of time in anticipation of the market breaking out and making a run. Trend traders can use the indicator to identify areas of price consolidation within a trend providing an opportunity for trend following traders to enter a position as prices breakout in the direction of the trend, or to exit an existing position should the market consolidate and then reverse.
When applied to a chart the breakout box indicator will draw trend lines at the support and resistance levels of each breakout box it detects and will then alert you when prices breakout of the box providing you with an opportunity to enter a trade, or build upon an existing position.
The breakout box indicator set also includes a FREE copy of our trailing stop indicators which we feel compliment our breakout box indicators.
100% Money Back Guarantee
You can try these indicators for 30 days risk free and evaluate them for yourself within TradeStation. If after purchasing these indicators you decide they are not right for you just let us know within 30 days for a full refund.
Screenshots
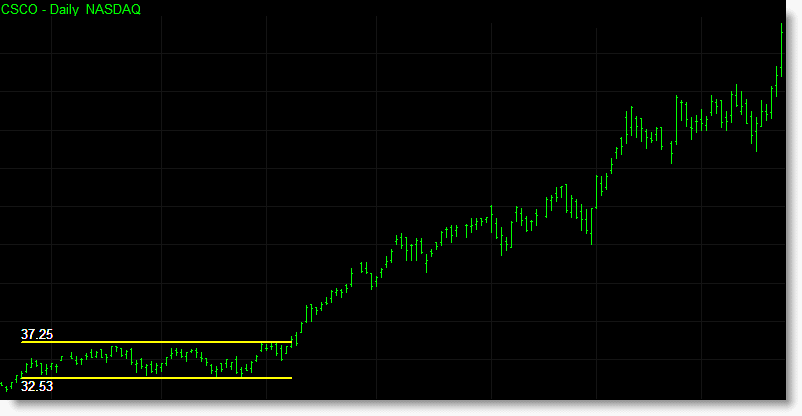
Long breakout boxes that have formed during a bullish phase in BNI. In addition to the yellow lines, which represent the top and bottom of the breakout box, the indicator also displays the actual top and bottom box values.

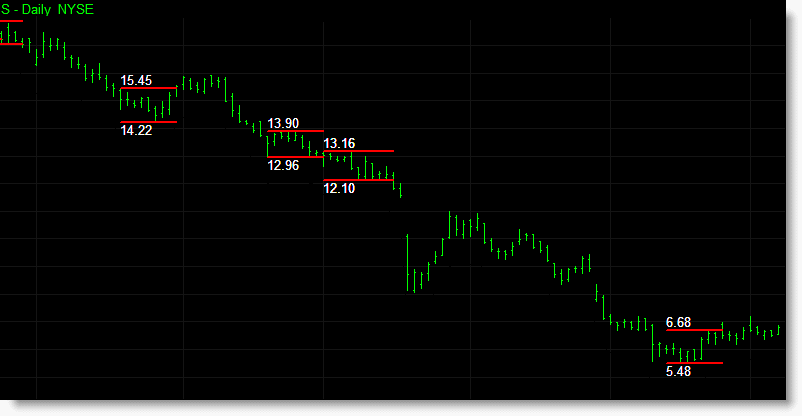
Short breakout boxes, this time in red, that have formed during a bearish market. Again the indicator identifies the breakout boxes both visually with red trend lines and with the actual box values as text on the chart.
Additional Information
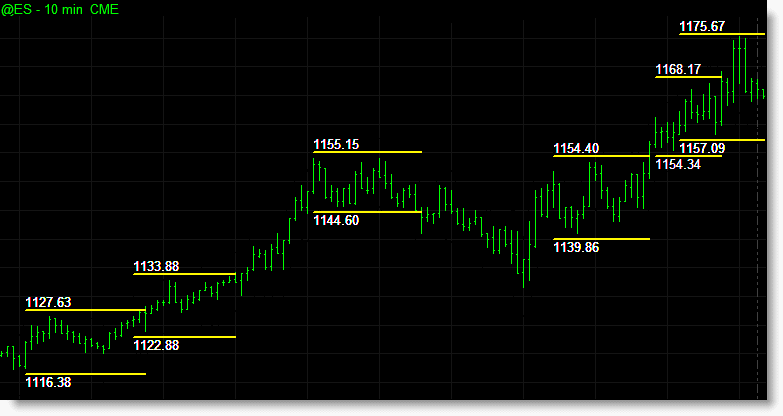
The breakout box indicators have been designed to be flexible by adding various settings including the ability to alter the minimum number of bars required when detecting breakout boxes, and the ability to set the top and bottom limits of the box based upon different prices and volatility. The chart below shows the breakout box set to find markets that have traded sideways within a narrow trading range for an extended period of time by identifying breakout boxes that have lasted more than 50 bars.
You can also set different prices to determine when a breakout occurs. For example using the high and low price will trigger a breakout of a box immediately. Using the closing price will only trigger a breakout if prices close outside the boxes range, but should prices breakout of a box intrabar and then retreat back into the box by the close of the bar then the current box would remain active. The chart below on the left shows a breakout box indicator set to detect breakouts that occur intrabar while the chart on the right identifies breakouts at the close of the bar, ignoring intrabar breakouts.

We have incorporated the option to include a trend filter as part of the indicator adding the requirement of a bullish/bearish trend prior to identifying a breakout box. The chart below shows long and short breakout boxes being identified while using a 50 bar moving average trend filter.

The breakout box indicators include the option to expand each boxes support/resistance levels by a set percentage so as to require a stronger price move to occur before triggering a breakout of the box thus eliminating small false breakouts signals. The indicator in the chart below has been set to include a 0.1% buffer to each Darvas boxes top and base.
When applied to a RadarScreen the breakout box indicator provides extra information in additional to displaying support and resistance values.
- Breakout – displays an alert message when the top or bottom of the box has been broken.
- Ratio – shows where the current price is in relation to the breakout box.
- Box Range – provides the range of the breakout box from top to base.
- Box Count – tells the user how many bars the breakout box has existed for.
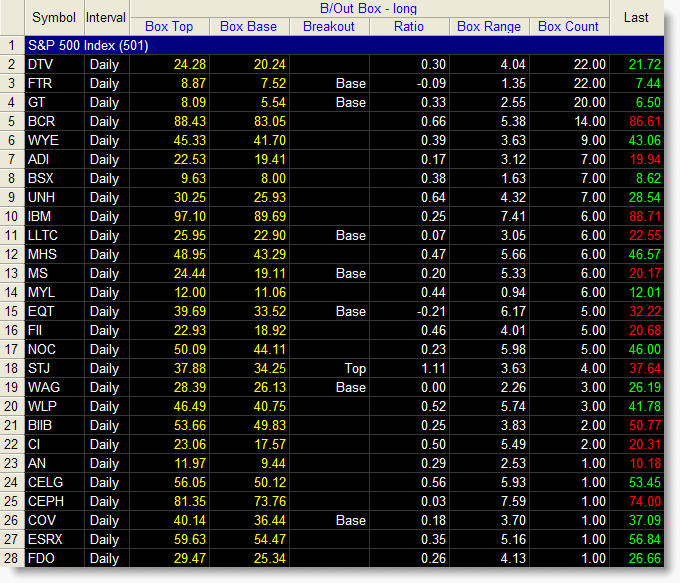
The breakout box indicator applied to a RadarScreen containing the S&P 500 stocks.
Standard Indicator Features
- Various inputs and settings to help customize and optimize each indicator.
- Can be applied within TradeStation using various tools, including charts, RadarScreens and scanner.
- Option to use TradeStation sound, message and email alerts.
- Includes PDF manual.
EasyLanguage Functions for TradeStation
All our indicators are provided in the form of an Easylanguage function. Easylanguage functions allow you to incorporate our indicators as part of your own strategies and indicators within TradeStation.
Delivery
You should expect to receive your order within 1 working day via email.
| 100% Money Back Guarantee These TradeStation compatible indicators come with a 30 day money back guarantee. During the first 30 days after purchasing these indicators you can use and evaluate these indicators as much as you like. If after purchasing these indicators you decide they are not right for you just let us know within 30 days for a full refund. |
||
Continued Support and Updates for a Minimum of 12 Months
All our products include full support and updates for at least 1 year so if you have any problems or require any additional information you can contact us for assistance.
If you have any questions about this, or any other product we offer, please contact us.
Disclaimer
All information provided is for educational purposes only and it should not be assumed that the information presented will be profitable or that it will not result in losses.
You understand and acknowledge that there is a high degree of risk involved in trading securities and/or currencies. TechnicalTradingIndicators.com assume no responsibility or liability for your trading and investment results and you agree not to hold the company liable for any monetary loss and/or damages of any kind. There is a high degree of risk in trading and you should always consult a qualified advisor about the suitability of any investment.
HYPOTHETICAL OR SIMULATED PERFORMANCE RESULTS HAVE CERTAIN LIMITATIONS. UNLIKE AN ACTUAL PERFORMANCE RECORD, SIMULATED RESULTS DO NOT REPRESENT ACTUAL TRADING. ALSO, SINCE THE TRADES HAVE NOT BEEN EXECUTED, THE RESULTS MAY HAVE UNDER-OR-OVER COMPENSATED FOR THE IMPACT, IF ANY, OF CERTAIN MARKET FACTORS, SUCH AS LACK OF LIQUIDITY. SIMULATED TRADING PROGRAMS IN GENERAL ARE ALSO SUBJECT TO THE FACT THAT THEY ARE DESIGNED WITH THE BENEFIT OF HINDSIGHT. NO REPRESENTATION IS BEING MADE THAT ANY ACCOUNT WILL OR IS LIKELY TO ACHIEVE PROFIT OR LOSSES SIMILAR TO THOSE SHOWN
Tradestation Disclaimer:
“Neither TradeStation Technologies nor any of its affiliates has reviewed, certified, endorsed, approved, disapproved or recommended, and neither does or will review, certify, endorse, approve, disapprove or recommend, any trading software tool that is designed to be compatible with the TradeStation Open Platform.”
Read our full disclaimer plus terms and conditions here.
