 Loading... Please wait...
- Home
- Indicators for TradeStation
- Bar Strength Indicator Set for TradeStation
The bar strength indicator is a simple indicator that evaluates where the market opened and closed relative to the bars trading range. Using the bar strength indicator traders can identify markets which have experienced a strong positive or negative price reaction on a specific day or bar.
The bar strength indicator can be applied using traditional bar strength, or internal bar strength, which is derived from the position of the close in relation to the range of the bar.
Alternatively the indicator also includes the option to take the position of the close relative to the range and so in addition to determining the position of the close within the trading range the indicator will also take into consideration the position of the open and perhaps more importantly the difference between the open and the close relative to the bars trading range.
Our bar strength indicators can be used to detect and highlight bars which meet a specific bar strength setup within a chart and also be employed to scan multiple symbols in TradeStations RadarScreen and scanner.
In addition to the bar strength indicators designed to detect and identify bars exhibiting a specific setup the bar strength indictors include two oscillator indicators. The first provides the traditional bar strength value based upon the closing price position within the bar while the second calculates the difference between where the bar opened and where it closed relative to the bars range.
Included within these indicators are multiple settings for customizing the indicators function and appearance and when to be alerted to potential trading opportunities.
The indicators can also be inserted into a TradeStation RadarScreen to scan the market for bar strength patterns.
100% Money Back Guarantee
You can try these indicators for 30 days risk free and evaluate them for yourself within TradeStation. If after purchasing these indicators you decide they are not right for you just let us know within 30 days for a full refund.
Screenshots
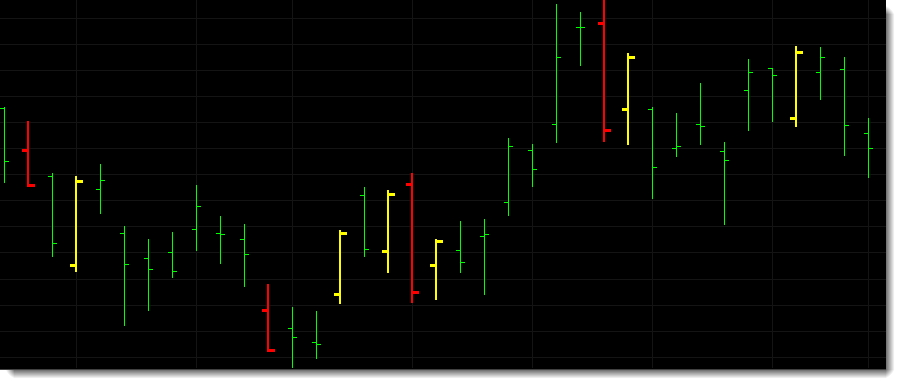
The screenshot below shows the bar strength indicator using the traditional bar strength formula and set to detect when the market has closed within the top or bottom 10% of the bars trading range. Bars where the market closed inside the top 10% of the range are painted yellow while bars closing in the bottom 10% are painted red.
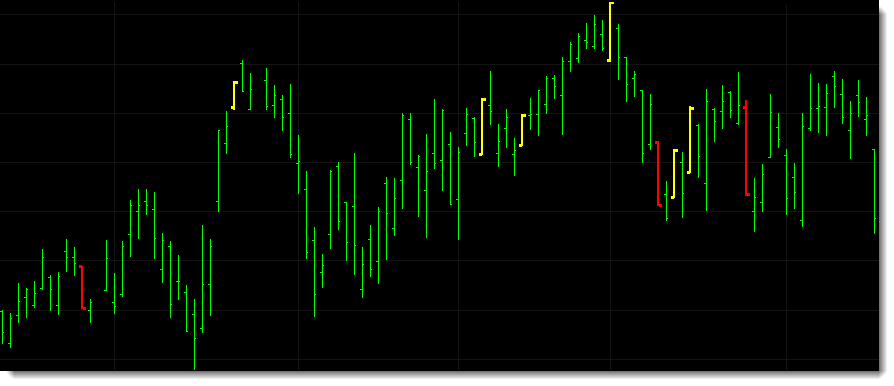
The AAPL chart below looks similar to the previous screenshot but in this example the indicator is also taking into consideration where the bar opened. In order for an up bar to be highlighted the open must be in the bottom 25% of the bars range and the close in the top 25% of the bars range. The reverse is true for a down bar to be detected.

The indicator is still monitoring the opening and closing prices in the screenshot below but in this example the indicator is set to identify bars where the distance between the open and the close is equal to at least 90% of the bars trading range.
For those that prefer not to paint the price bars the indicator includes the alternative to display a dot above or below the highlighted bar as demonstrated below.

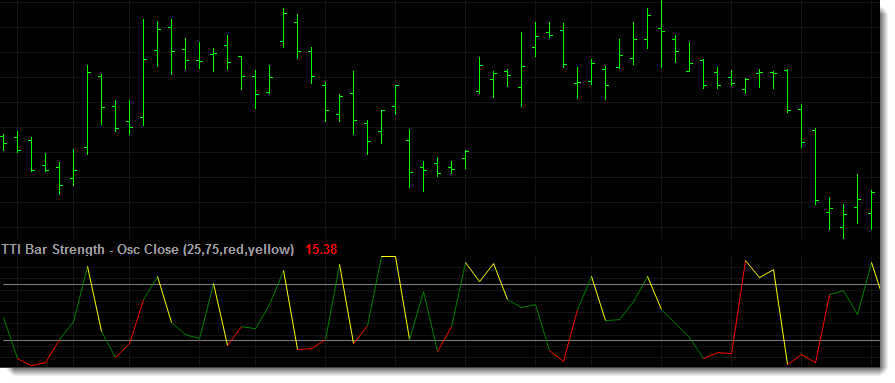
The example below shows the traditional bar strength oscillator indicator applied to GM which is showing where the market has closed relative to the bars range.
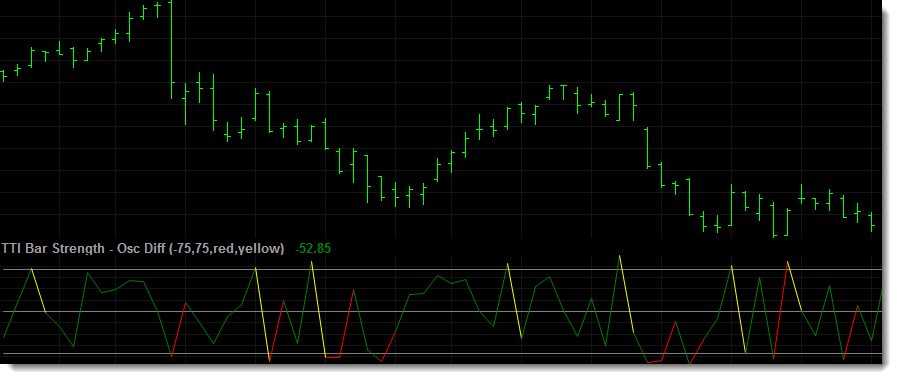
The KLAC chart below shows the second bar strength oscillator. This indicator calculates the difference between the opening and closing prices relative to the bars trading range.
Additional Information
The bar strength indicators include multiple settings for adjusting the type and intensity of the bar strength pattern detected.
When applied to RadarScreen the bar strength indicator provides additional information.
- Open Range - displays where the open is within the trading range of the bar. A value of 0% would mean the open is at the low of the bar. A value of 100% means the open is at the high of the bar.
- Close Range - displays where the close is within the trading range of the bar. A value of 0% would mean the close is at the low of the bar. A value of 100% means the close is at the high of the bar.
- O-C Diff - displays the difference between the open and close as a percentage of the bars trading range. A value of 100% would mean the open and close should occur at the high and low of the bar. A value of 50% means that at least half of the bars trading range should be between the open and the close.

The bar strength indicator applied to a RadarScreen.
Standard Indicator Features
- Various inputs and settings to help customize and optimize each indicator.
- Can be applied within TradeStation using various tools, including charts, RadarScreens and scanner.
- Option to use TradeStation sound, message and email alerts.
- Includes PDF manual.
Delivery
You should expect to receive your order within 1 working day via email.
| 100% Money Back Guarantee These TradeStation compatible indicators come with a 30 day money back guarantee. During the first 30 days after purchasing these indicators you can use and evaluate these indicators as much as you like. If after purchasing these indicators you decide they are not right for you just let us know within 30 days for a full refund. |
||
Continued Support and Updates for a Minimum of 12 Months
All our products include full support and updates for at least 1 year so if you have any problems or require any additional information you can contact us for assistance.
If you have any questions about this, or any other product we offer, please contact us.
Disclaimer
All information provided is for educational purposes only and it should not be assumed that the information presented will be profitable or that it will not result in losses.
You understand and acknowledge that there is a high degree of risk involved in trading securities and/or currencies. TechnicalTradingIndicators.com assume no responsibility or liability for your trading and investment results and you agree not to hold the company liable for any monetary loss and/or damages of any kind. There is a high degree of risk in trading and you should always consult a qualified advisor about the suitability of any investment.
HYPOTHETICAL OR SIMULATED PERFORMANCE RESULTS HAVE CERTAIN LIMITATIONS. UNLIKE AN ACTUAL PERFORMANCE RECORD, SIMULATED RESULTS DO NOT REPRESENT ACTUAL TRADING. ALSO, SINCE THE TRADES HAVE NOT BEEN EXECUTED, THE RESULTS MAY HAVE UNDER-OR-OVER COMPENSATED FOR THE IMPACT, IF ANY, OF CERTAIN MARKET FACTORS, SUCH AS LACK OF LIQUIDITY. SIMULATED TRADING PROGRAMS IN GENERAL ARE ALSO SUBJECT TO THE FACT THAT THEY ARE DESIGNED WITH THE BENEFIT OF HINDSIGHT. NO REPRESENTATION IS BEING MADE THAT ANY ACCOUNT WILL OR IS LIKELY TO ACHIEVE PROFIT OR LOSSES SIMILAR TO THOSE SHOWN
Tradestation Disclaimer:
“Neither TradeStation Technologies nor any of its affiliates has reviewed, certified, endorsed, approved, disapproved or recommended, and neither does or will review, certify, endorse, approve, disapprove or recommend, any trading software tool that is designed to be compatible with the TradeStation Open Platform.”
Read our full disclaimer plus terms and conditions here.
