 Loading... Please wait...
- Home
- Indicators for TradeStation
- Trailing Stop Indicator Set for TradeStation
A trailing stop is commonly used as a systematic way to know when to exit a trade. As the market moves higher or lower the trailing stop follows at a predetermined level giving the market room to fluctuate and then continue on its path, or should the market reverse the trailing stop provides a systematic level at which to close a position.
These types of stops are especially useful for trend traders and breakout traders who like to let profits run while maintaining a logical exit for when the market trend changes so they can exit their position in a controlled and timely manner.
We have programmed two sets of trailing stop indicators. The first set uses average true range (ATR) when determining placement of the trailing stop. The ATR of the market is calculated first and once calculated the ATR is multiplied based upon how tight or loose the trader wants to set the trailing stop as it follows the market.
The second set of trailing stop indicators trail the market at a fixed percentage set by trader. Both sets of trailing stop indicators are included.
100% Money Back Guarantee
You can try these indicators for 30 days risk free and evaluate them for yourself within TradeStation. If after purchasing these indicators you decide they are not right for you just let us know within 30 days for a full refund.
Screenshots
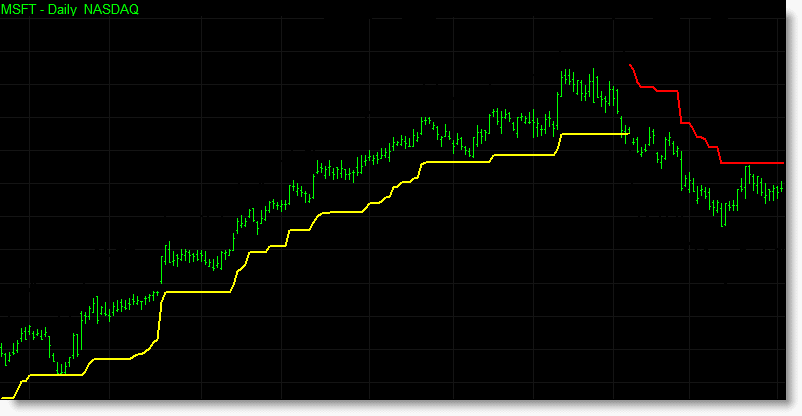
During a bullish run in MSFT the long (yellow) trailing stop continuously follows the market higher until the market reverses and crosses the trailing stop. Once crossed the short (red) trailing stop is activated and begins to trail MSFT lower.
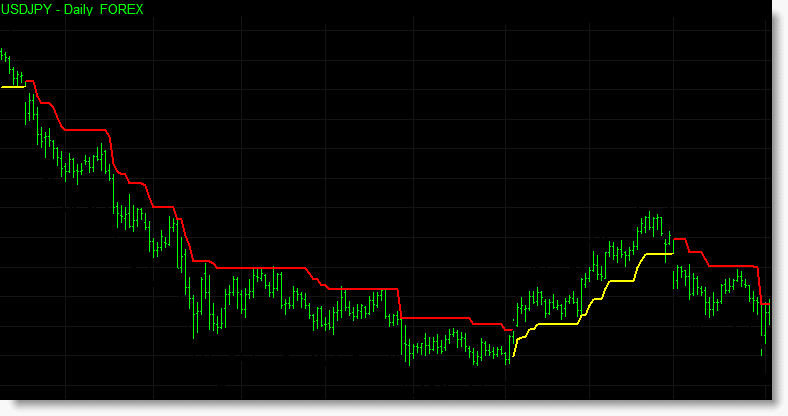
In the chart below the forex market begins a bearish run, accompanied by a short (red) trailing stop. After a period of consolidation the market becomes bullish triggering the long (yellow) trailing stop. Later the short trailing stop becomes active again.
Additional Information
As you can see in the charts above the indicator continually alternates between long and short trailing stops, changing color as it goes.
Both the ATR trailing stop indicators and the percentage trailing stop indicators allow you to adjust at what level to initially set the trailing stop and from what price to trail the stop.
When applied to a RadarScreen the trailing stop indicator provides additional information beyond the value of the trailing stop.
- Bar Count – shows how many bars that the current trailing stop has been active.
- Ratio – shows where the current price is in relation to the active trailing stop.
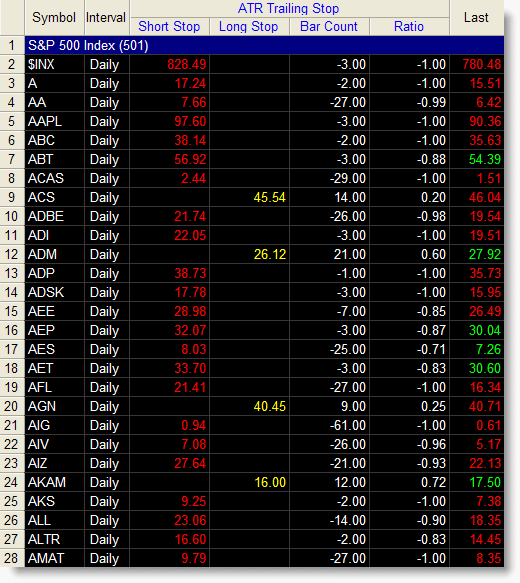
The ATR trailing stop indicator applied to a RadarScreen containing the S&P 500 stocks.
Standard Indicator Features
- Various inputs and settings to help customize and optimize each indicator.
- Can be applied within TradeStation using various tools, including charts, RadarScreens and scanner.
- Option to use TradeStation sound, message and email alerts.
- Includes PDF manual.
EasyLanguage Functions for TradeStation
All our indicators are provided in the form of an Easylanguage function. Easylanguage functions allow you to incorporate our indicators as part of your own strategies and indicators within TradeStation.
Delivery
You should expect to receive your order within 1 working day via email.
| 100% Money Back Guarantee These TradeStation compatible indicators come with a 30 day money back guarantee. During the first 30 days after purchasing these indicators you can use and evaluate these indicators as much as you like. If after purchasing these indicators you decide they are not right for you just let us know within 30 days for a full refund. |
||
Continued Support and Updates for a Minimum of 12 Months
All our products include full support and updates for at least 1 year so if you have any problems or require any additional information you can contact us for assistance.
If you have any questions about this, or any other product we offer, please contact us.
Disclaimer
All information provided is for educational purposes only and it should not be assumed that the information presented will be profitable or that it will not result in losses.
You understand and acknowledge that there is a high degree of risk involved in trading securities and/or currencies. TechnicalTradingIndicators.com assume no responsibility or liability for your trading and investment results and you agree not to hold the company liable for any monetary loss and/or damages of any kind. There is a high degree of risk in trading and you should always consult a qualified advisor about the suitability of any investment.
HYPOTHETICAL OR SIMULATED PERFORMANCE RESULTS HAVE CERTAIN LIMITATIONS. UNLIKE AN ACTUAL PERFORMANCE RECORD, SIMULATED RESULTS DO NOT REPRESENT ACTUAL TRADING. ALSO, SINCE THE TRADES HAVE NOT BEEN EXECUTED, THE RESULTS MAY HAVE UNDER-OR-OVER COMPENSATED FOR THE IMPACT, IF ANY, OF CERTAIN MARKET FACTORS, SUCH AS LACK OF LIQUIDITY. SIMULATED TRADING PROGRAMS IN GENERAL ARE ALSO SUBJECT TO THE FACT THAT THEY ARE DESIGNED WITH THE BENEFIT OF HINDSIGHT. NO REPRESENTATION IS BEING MADE THAT ANY ACCOUNT WILL OR IS LIKELY TO ACHIEVE PROFIT OR LOSSES SIMILAR TO THOSE SHOWN
Tradestation Disclaimer:
“Neither TradeStation Technologies nor any of its affiliates has reviewed, certified, endorsed, approved, disapproved or recommended, and neither does or will review, certify, endorse, approve, disapprove or recommend, any trading software tool that is designed to be compatible with the TradeStation Open Platform.”
Read our full disclaimer plus terms and conditions here.
