 Loading... Please wait...
- Home
- Indicators for TradeStation
- Market Phase Trend Indicator Set for TradeStation
The market phase indicator set is based upon the work of Chuck Dukas and his approach to identifying the trend of the market. The indicator set consists of three main indicators:
1. The phase indicator identifies which of the six phases the market is currently in.
2. The slope indicator determines if each of the three price series are trending higher or lower.
3. The channel indicator identifies when the market is making new consecutive highs and lows.
Each of these indicators can be applied individually to identify the prevailing trend.
Alternatively the trend identification techniques off all three indicators can be combined to provide a stronger trend diagnosis of the market. A fourth indicator is included which incorporates all three techniques, the trend indicator.
100% Money Back Guarantee
You can try these indicators for 30 days risk free and evaluate them for yourself within TradeStation. If after purchasing these indicators you decide they are not right for you just let us know within 30 days for a full refund.
1. The Phase Indicator
The phase indicator identifies which trend phase the market is in using three price series of varying lengths. Based upon the relationship between these three price series the market is placed into one of six possible trend phases ranging from +3 for the bullish phase to -3 for the bearish phase.
+3 Bullish
+2 Accumulation
+1 Recovery
-1 Warning
-2 Distribution
-3 Bearish
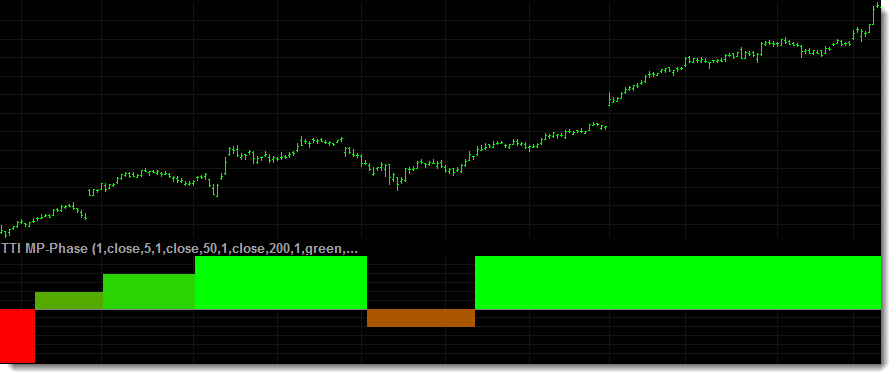
The image above shows the phase indicator applied to a chart of AAPL as the stock moves from 'recovery' to 'accumulation' to 'bullish'. During its climb AAPL briefly stalls before resuming its bullish trend.
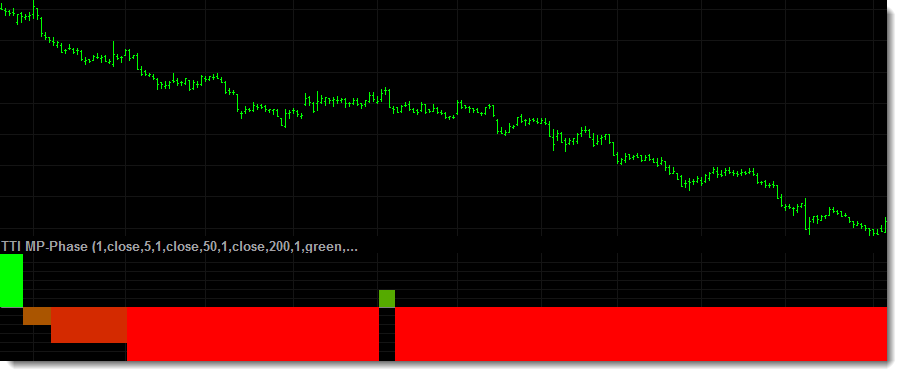
Another example of the phase indicator but this time during a bearish trend as the market begins to decline.
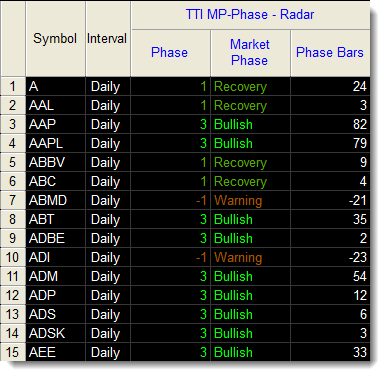
When applied to a RadarScreen the phase indicator provides additional information.
- Phase - displays the current trend phase on a scale of -3 to +3.
- Market Phase - displays the name of the current trend phase.
- Phase Bars - shows the total number of consecutive bars the market has been in the current phase.
2. The Slope Indicator
The slope indicator uses the same three price series as the phase indicator. However, instead of comparing the price series to each other this indicator is concerned with how each price series is performing relative to itself. Traders can select which price series, or combination of price series, to include when determining the trend of the market:

The screenshot above shows the slope indicator applied to a stock during the strong bullish trend. As the trend continues the indicator counts the number of bars the trend has been in effect for.

In the chart above the slope indicator transitions from a bearish trend into a bullish trend.

When applied to a RadarScreen the slope indicator provides additional information.
- Slope 1 - displays the increase/decrease of price series 1.
- Slope 2 - displays the increase/decrease of price series 2.
- Slope 3 - displays the increase/decrease of price series 3.
- Slope Trend - displays if the market is currently bullish or bearish.
- Slope Bars - shows the total number of consecutive bars the market has been in the current trend.
3. The Channel Indicator
The channel indicator calculates the highest and lowest prices over a set number of bars to identify when the market is making new relative highs and lows. The indicator continues to keep track as the market makes successive new highs or lows.
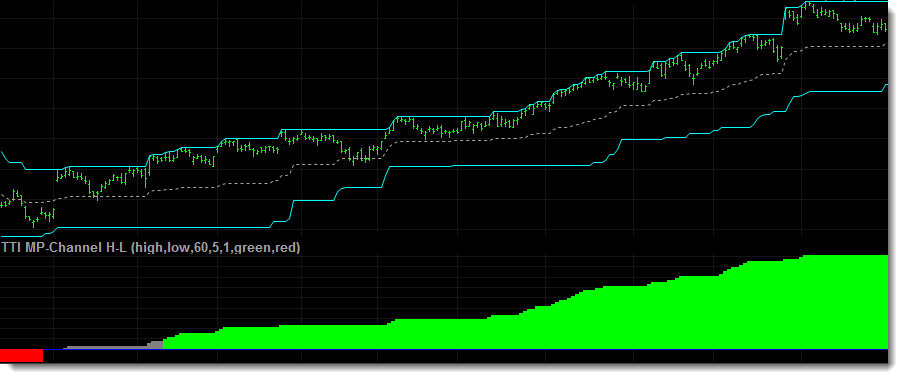
The image above shows the channel indicators applied to a chart. The first indicator draws the high/low trading channel, along with the midpoint, on the price chart. The second indicator plots a histogram sub graph when the market establishes a new high or low and the value accumulates which each successive new high or low. Once a minimum number of consecutive new highs/lows are detected the indicator changes color.
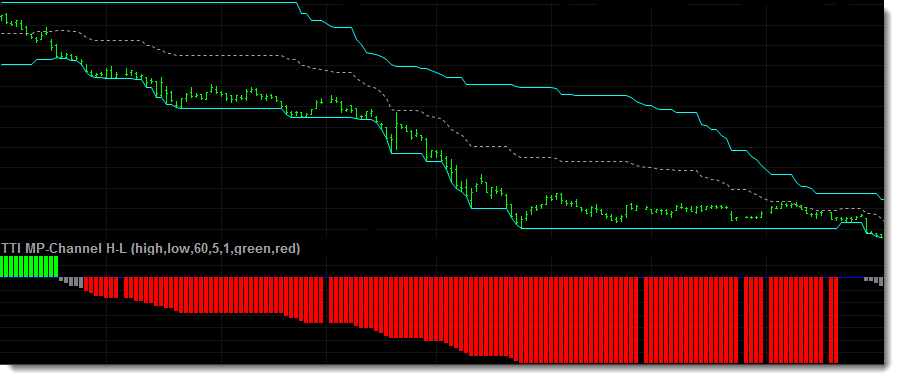
The channel indicators being applied to a market during a bearish trend.
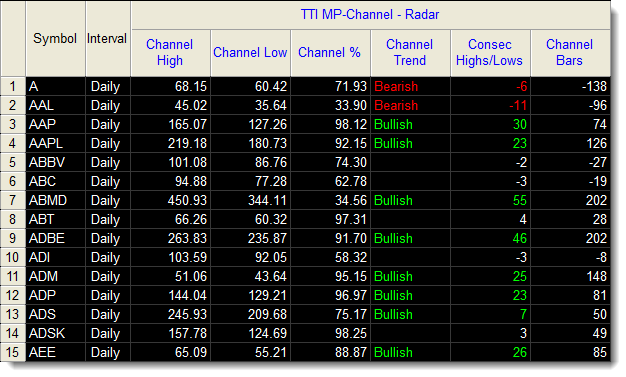
When applied to a RadarScreen the channel indicator provides additional information.
- Channel High - displays the high value of the channel.
- Channel Low - displays the low value of the channel.
- Channel % - shows the current position of the market relative to the range of the channel. 0% means the market is at the low of the channel while 100% means the market is at the high.
- Channel Trend - displays if the market is currently bullish or bearish.
- Consec Highs/Lows - shows the number of consecutive new highs or lows.
- Channel Bars - shows the total number of consecutive bars the market has been in the current trend.
4. The Trend Indicator
The trend indicator combines the previous three indicators into one indicator allowing you to combine the different trend detection methods into a stronger trend diagnosis.
The primary indicator is the phase indicator and traders can select at which phase the trend detection begins. Once the selected phase has been established the indicator looks to confirm the trend using the two other indicators. The trend is established once all three indictors agree on the direction of the market.

The image above shows the trend indicators applied to a chart. The first indicator colors the bars on the price chart to correspond with the trend with green for a bullish trend, red for a bearish trend and gray when no trend is established. The second indicator plots a histogram sub graph when the market is bullish or bearish and the value accumulates with each successive bar of the trend.
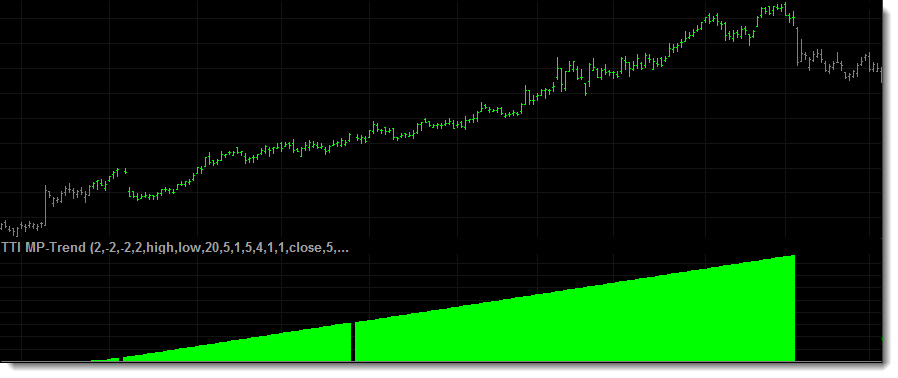
This chart shows the market phase trend indicator detecting a bullish trend as it forms and then continues until the market begins to sell off.
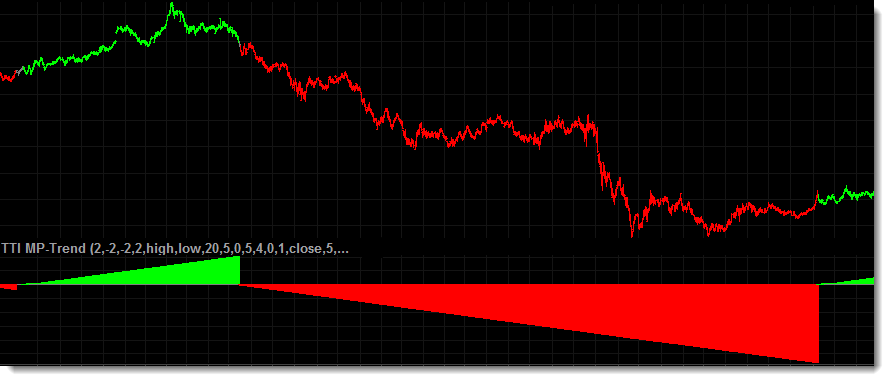
The chart above shows the trend indicator as it detects a strong bearish trend in the stock and then follows it until the market starts to reverse.
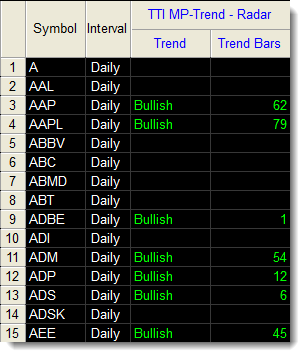
When applied to a RadarScreen the market phase trend indicator provides additional information.
- Trend - displays if the market is currently bullish or bearish.
- Trend Bars - shows the total number of consecutive bars the market has been in the current trend.
Standard Indicator Features
- Various inputs and settings to help customize and optimize each indicator.
- Can be applied within TradeStation using various tools, including charts, RadarScreens and scanner.
- Option to use TradeStation sound, message and email alerts.
- Includes PDF manual.
Delivery
You should expect to receive your order within 1 working day via email.
| 100% Money Back Guarantee These TradeStation compatible indicators come with a 30 day money back guarantee. During the first 30 days after purchasing these indicators you can use and evaluate these indicators as much as you like. If after purchasing these indicators you decide they are not right for you just let us know within 30 days for a full refund. |
||
Continued Support and Updates for a Minimum of 12 Months
All our products include full support and updates for at least 1 year so if you have any problems or require any additional information you can contact us for assistance.
If you have any questions about this, or any other product we offer, please contact us.
Disclaimer
All information provided is for educational purposes only and it should not be assumed that the information presented will be profitable or that it will not result in losses.
You understand and acknowledge that there is a high degree of risk involved in trading securities and/or currencies. TechnicalTradingIndicators.com assume no responsibility or liability for your trading and investment results and you agree not to hold the company liable for any monetary loss and/or damages of any kind. There is a high degree of risk in trading and you should always consult a qualified advisor about the suitability of any investment.
HYPOTHETICAL OR SIMULATED PERFORMANCE RESULTS HAVE CERTAIN LIMITATIONS. UNLIKE AN ACTUAL PERFORMANCE RECORD, SIMULATED RESULTS DO NOT REPRESENT ACTUAL TRADING. ALSO, SINCE THE TRADES HAVE NOT BEEN EXECUTED, THE RESULTS MAY HAVE UNDER-OR-OVER COMPENSATED FOR THE IMPACT, IF ANY, OF CERTAIN MARKET FACTORS, SUCH AS LACK OF LIQUIDITY. SIMULATED TRADING PROGRAMS IN GENERAL ARE ALSO SUBJECT TO THE FACT THAT THEY ARE DESIGNED WITH THE BENEFIT OF HINDSIGHT. NO REPRESENTATION IS BEING MADE THAT ANY ACCOUNT WILL OR IS LIKELY TO ACHIEVE PROFIT OR LOSSES SIMILAR TO THOSE SHOWN
Tradestation Disclaimer:
“Neither TradeStation Technologies nor any of its affiliates has reviewed, certified, endorsed, approved, disapproved or recommended, and neither does or will review, certify, endorse, approve, disapprove or recommend, any trading software tool that is designed to be compatible with the TradeStation Open Platform.”
Read our full disclaimer plus terms and conditions here.
