 Loading... Please wait...
- Home
- Indicators for TradeStation
- Flag and Pennant Indicator Set for TradeStation
Flags and pennants are areas of price consolidation that occur after a strong bullish or bearish market move. The flag pattern occurs when markets trade between a narrow sloping trading range with the range between support and resistance remaining constant whereas the pennant pattern forms as the range narrows between support and resistance with each successive bar.
When identifying flag and pennant patterns it is common practice to first identify a strong market move preceding the consolidation, known as the flag pole, which can occur on a single bar or over multiple bars. After the formation of the flag pole we then wait for prices to consolidate in the form of a flag or pennant pattern before market momentum continues.
Traders can use these indicators to identify markets which have consolidated in anticipation of the market breaking out and making a run or to find areas of price consolidation within an existing trend.
The flag and pennant indicator set also includes a FREE copy of our acceleration indicator which we feel compliment our flag and pennant indicators.
100% Money Back Guarantee
You can try these indicators for 30 days risk free and evaluate them for yourself within TradeStation. If after purchasing these indicators you decide they are not right for you just let us know within 30 days for a full refund.
Screenshots
Below are four examples illustrating each of the four specific patterns detected by the flag and pennant indicators.
 |
 |
||
|
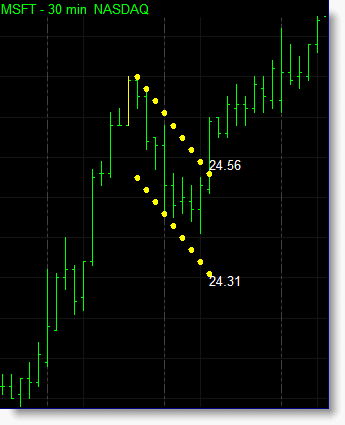
Bullish Flag.
|
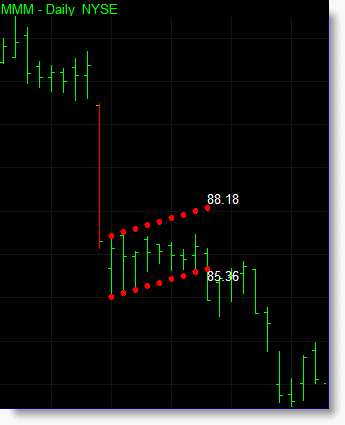
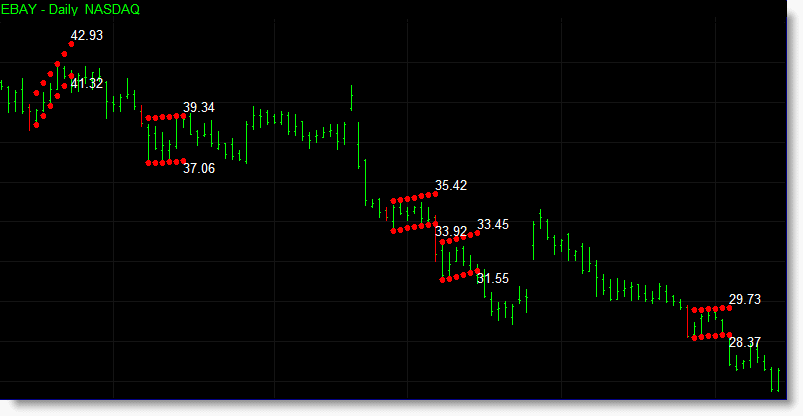
Bearish Flag.
|
 |
 |
||
|
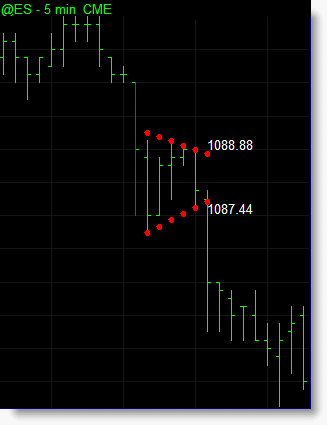
Bullish Pennant.
|
Bearish Pennant.
|
The bullish flag indicator is applied to a MSFT chart below. During this bullish trend a number of flag patterns form and are identified in yellow. The indicator also displays the current support and resistance levels for each flag as text on the chart itself.

The chart below shows the bearish flag indicator being used during a bearish trend in EBAY.
Additional Information
The flag and pennant indicators identify the upper and lower boundaries of flag and pennant formations as they progress from bar-to-bar and detect when the market breaks out of the pattern.
The indicators include a number of different inputs allowing you to easily adjust the indicator to suit your personal requirements including the ability to set which prices are used in identifying areas of price consolidation.
You can also set minimum requirements for detecting each flag or pennant formation. For example you can set the minimum number of bars required for price to consolidate before determining areas of support and resistance, and the maximum and minimum consolidation range (volatility) of each flag or pennant to eliminate flags or pennants that might be considered too wide ranging, or to have too narrow a trading range, to be tradable. This way you can focus the indicator to look for the flags or pennants you feel best suit your requirements.
You can set which prices are used to identify when the market has broken out of a flag or pennant formation. Using the high and low will trigger a breakout of a flag or pennant immediately once prices break through support or resistance, while using the close will allow prices to breakout intrabar but retrace back into the flag or pennant on the same bar without eliminating the pattern itself. The chart on the left shows the flag pattern indicator set to detect breakouts that occur intrabar while the chart on the right identifies flag breakouts at the close of the bar, ignoring intrabar breakouts of the flag pattern.

The indicators include a buffer function which allows you to increase the value of the top and base levels requiring stronger market moves to trigger a breakout of the flag or pennant pattern in an attempt to reduce small false breakouts. Below are two examples of the flag indicator applied to charts of IBM and AMZN which have a 1% buffer applied to each.

Both the flag and pennant indicators incorporate our new acceleration indicator which uses a dynamic approach to measuring market momentum. The acceleration formula compliments these indicators by identifying flag poles prior to the main flag and pennant price formations.
We have also included the optional to identify flags and pennants that form without the initial market thrust (flag pole) and a trend filter to help identify flags and pennants which occur in trending markets or at new price levels.
When applied to a RadarScreen the flag and pennant indicators provide additional information beyond the support and resistance value of each pattern.
- Breakout – displays an alert message, which can be set by the user, when the top or base of a flag or pennant has been broken.
- Ratio – shows where the current price is in relation to the flag or pennant. A value between 0-1 means that the current price is inside the flag or pennant with 0 being the base of the flag or pennant and 1 being the top of the flag or pennant. A ratio value below 0 means price is currently below the flag or pennant and a ratio value above 1 means price is currently above the flag or pennant.
- Flag Range – provides the range of the flag or pennant from support to resistance.
- Flag Count – shows how many bars make up the current flag or pennant.
- Flag ROC - shows the rate of increase/decrease in the flag or pennant per bar.
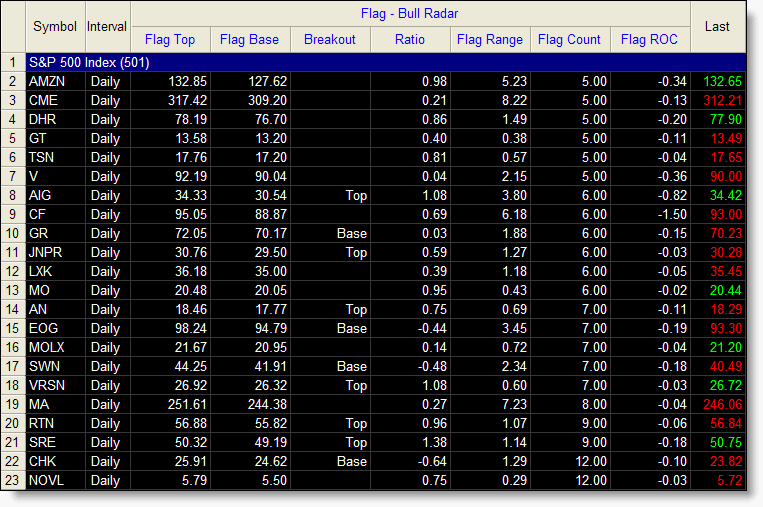
The flag indicator applied to a RadarScreen containing the S&P 500 stocks.
Standard Indicator Features
- Various inputs and settings to help customize and optimize each indicator.
- Can be applied within TradeStation using various tools, including charts, RadarScreens and scanner.
- Option to use TradeStation sound, message and email alerts.
- Includes PDF manual.
EasyLanguage Functions For TradeStation
All our indicators are provided in the form of an Easylanguage function. Easylanguage functions allow you to incorporate our indicators as part of your own strategies and indicators within TradeStation.
Delivery
You should expect to receive your order within 1 working day via email.
| 100% Money Back Guarantee These TradeStation compatible indicators come with a 30 day money back guarantee. During the first 30 days after purchasing these indicators you can use and evaluate these indicators as much as you like. If after purchasing these indicators you decide they are not right for you just let us know within 30 days for a full refund. |
||
Continued Support and Updates for a Minimum of 12 Months
All our products include full support and updates for at least 1 year so if you have any problems or require any additional information you can contact us for assistance.
If you have any questions about this, or any other product we offer, please contact us.
Disclaimer
All information provided is for educational purposes only and it should not be assumed that the information presented will be profitable or that it will not result in losses.
You understand and acknowledge that there is a high degree of risk involved in trading securities and/or currencies. TechnicalTradingIndicators.com assume no responsibility or liability for your trading and investment results and you agree not to hold the company liable for any monetary loss and/or damages of any kind. There is a high degree of risk in trading and you should always consult a qualified advisor about the suitability of any investment.
HYPOTHETICAL OR SIMULATED PERFORMANCE RESULTS HAVE CERTAIN LIMITATIONS. UNLIKE AN ACTUAL PERFORMANCE RECORD, SIMULATED RESULTS DO NOT REPRESENT ACTUAL TRADING. ALSO, SINCE THE TRADES HAVE NOT BEEN EXECUTED, THE RESULTS MAY HAVE UNDER-OR-OVER COMPENSATED FOR THE IMPACT, IF ANY, OF CERTAIN MARKET FACTORS, SUCH AS LACK OF LIQUIDITY. SIMULATED TRADING PROGRAMS IN GENERAL ARE ALSO SUBJECT TO THE FACT THAT THEY ARE DESIGNED WITH THE BENEFIT OF HINDSIGHT. NO REPRESENTATION IS BEING MADE THAT ANY ACCOUNT WILL OR IS LIKELY TO ACHIEVE PROFIT OR LOSSES SIMILAR TO THOSE SHOWN
Tradestation Disclaimer:
“Neither TradeStation Technologies nor any of its affiliates has reviewed, certified, endorsed, approved, disapproved or recommended, and neither does or will review, certify, endorse, approve, disapprove or recommend, any trading software tool that is designed to be compatible with the TradeStation Open Platform.”
Read our full disclaimer plus terms and conditions here.
