 Loading... Please wait...
- Home
- Indicators for TradeStation
- Volatility Bands Indicator Set for TradeStation
The volatility bands indicators can calculate the volatility bands of a market based upon its historic volatility or its implied volatility. Volatility bands provide a statistical probability that market prices will remain within the bands over a set time.
Our volatility band indicators come in two formats. The first displays as a regular band indicator around daily price data, similar to Bollinger bands. The second is an intraday version which extracts the information obtained from daily volatility levels and displays it on an intraday chart throughout the day.
Below is a chart showing the expected probability that prices will remain between the corresponding volatility bands.
|
Standard Deviation
|
Probability
|
||
|
1.00
|
68%
|
||
|
1.28
|
80%
|
||
|
1.50
|
88%
|
||
|
2.00
|
95%
|
100% Money Back Guarantee
You can try these indicators for 30 days risk free and evaluate them for yourself within TradeStation. If after purchasing these indicators you decide they are not right for you just let us know within 30 days for a full refund.
Screenshots
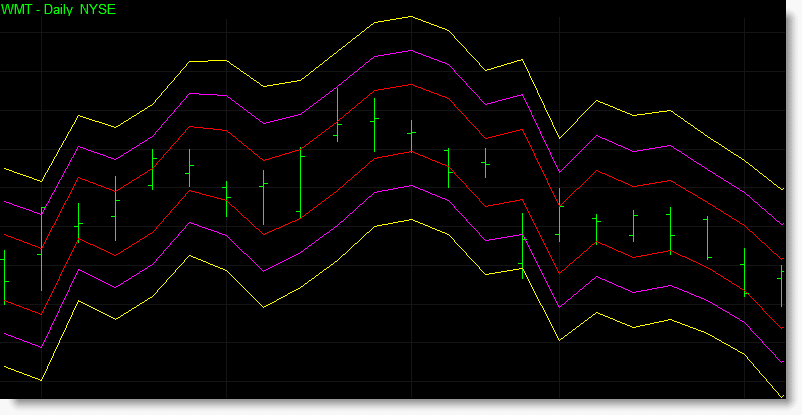
The daily bar chart of WMT contains three sets of volatility bands based upon 1, 2 and 3 standard deviations from the close.
Our intraday version of the indicators extract the same information obtained from the daily bands indicators and displays this information throughout the day. The chart below is of an intraday chart of WMT using the same three volatility bands as the WMT daily bar chart above.

Additional Information
The volatility band indicators include a number of settings allowing you to personalize the indicators including the ability to change the price used to calculate each set of volatility bands. You can also adjust the standard deviation used and the amount of volatility to set each pair of bands.
Each volatility band indicator is provided as both an end-of-day version and an intraday version. The intraday version maintains the same band value during the whole day and can be synced with daily bars to display volatility band values from a daily moving average within an intraday chart. The intraday version of the volatility bands indicator also includes the option to override when each new set of volatility bands are calculated by setting the time of the bar you wish to re-calculate the bands and the ability to apply a gapless structure to the indicator.
When applied to a RadarScreen the volatility bands indicator displays the upper and lower band values plus additional information.
- Ratio – shows where the current price is in relation to the volatility bands. A value between 0-1 means that the current price is within both bands with 0 being the lower band and 1 being the upper band. A ratio value below 0 means price is currently below the lower band and a ratio value above 1 means price is currently above the upper band.
- Vola Range – provides the range of the volatility bands from upper to lower band.

The volatility bands indicator applied to a RadarScreen containing the S&P 100 stocks.
Standard Indicator Features
- Various inputs and settings to help customize and optimize each indicator.
- Can be applied within TradeStation using various tools, including charts, RadarScreens and scanner.
- Option to use TradeStation sound, message and email alerts.
- Includes PDF manual.
EasyLanguage Functions For TradeStation
All our indicators are provided in the form of an Easylanguage function. Easylanguage functions allow you to incorporate our indicators as part of your own strategies and indicators within TradeStation.
Delivery
You should expect to receive your order within 1 working day via email.
| 100% Money Back Guarantee These TradeStation compatible indicators come with a 30 day money back guarantee. During the first 30 days after purchasing these indicators you can use and evaluate these indicators as much as you like. If after purchasing these indicators you decide they are not right for you just let us know within 30 days for a full refund. |
||
Continued Support and Updates for a Minimum of 12 Months
All our products include full support and updates for at least 1 year so if you have any problems or require any additional information you can contact us for assistance.
If you have any questions about this, or any other product we offer, please contact us.
Disclaimer
All information provided is for educational purposes only and it should not be assumed that the information presented will be profitable or that it will not result in losses.
You understand and acknowledge that there is a high degree of risk involved in trading securities and/or currencies. TechnicalTradingIndicators.com assume no responsibility or liability for your trading and investment results and you agree not to hold the company liable for any monetary loss and/or damages of any kind. There is a high degree of risk in trading and you should always consult a qualified advisor about the suitability of any investment.
HYPOTHETICAL OR SIMULATED PERFORMANCE RESULTS HAVE CERTAIN LIMITATIONS. UNLIKE AN ACTUAL PERFORMANCE RECORD, SIMULATED RESULTS DO NOT REPRESENT ACTUAL TRADING. ALSO, SINCE THE TRADES HAVE NOT BEEN EXECUTED, THE RESULTS MAY HAVE UNDER-OR-OVER COMPENSATED FOR THE IMPACT, IF ANY, OF CERTAIN MARKET FACTORS, SUCH AS LACK OF LIQUIDITY. SIMULATED TRADING PROGRAMS IN GENERAL ARE ALSO SUBJECT TO THE FACT THAT THEY ARE DESIGNED WITH THE BENEFIT OF HINDSIGHT. NO REPRESENTATION IS BEING MADE THAT ANY ACCOUNT WILL OR IS LIKELY TO ACHIEVE PROFIT OR LOSSES SIMILAR TO THOSE SHOWN
Tradestation Disclaimer:
“Neither TradeStation Technologies nor any of its affiliates has reviewed, certified, endorsed, approved, disapproved or recommended, and neither does or will review, certify, endorse, approve, disapprove or recommend, any trading software tool that is designed to be compatible with the TradeStation Open Platform.”
Read our full disclaimer plus terms and conditions here.
