 Loading... Please wait...
- Home
- Indicators for TradeStation
- Moving Average Trend Indicator for TradeStation
The moving average trend indicator is designed as a visually more appealing alternative to displaying a moving average within a TradeStation chart. By monitoring where price is in relation to the moving average being utilized the indicator will change color to indicate if price is trading above or below the moving average.
The moving average trend indicator takes advantage of nine of the most popular moving averages found within TradeStation to provide a visually improved moving average indicator to quickly and easily identify the trend of the market.
1. Simple moving average
2. Exponential moving average
3. Triangular moving average
4. Weighted moving average
5. Hull moving average
6. Double exponential moving average
7. Triple exponential moving average
8. Quadruple exponential moving average
9. Volume weighted moving average
In addition to comparing the market price to a moving average the indicator can also be used to compare two moving averages against each other to determine the trend of the market.
This indicator offers traders who employ moving averages as part of their trading toolbox the ability to quickly and easily identify the prevailing trend.
The indicator can also be inserted into a TradeStation Radarscreen to monitor the moving average trend across multiple markets. The indicator can be used to scan and identify markets where the trend has changed and the moving average has crossed or to identify markets in a long term bullish/bearish trend.
100% Money Back Guarantee
You can try these indicators for 30 days risk free and evaluate them for yourself within TradeStation. If after purchasing these indicators you decide they are not right for you just let us know within 30 days for a full refund.
Screenshots
The screenshot below shows the moving average trend indicator applied to a chart. As the market crosses below the moving average the moving average line changes color from green to red and when price crosses back above the moving average the line turns green again.

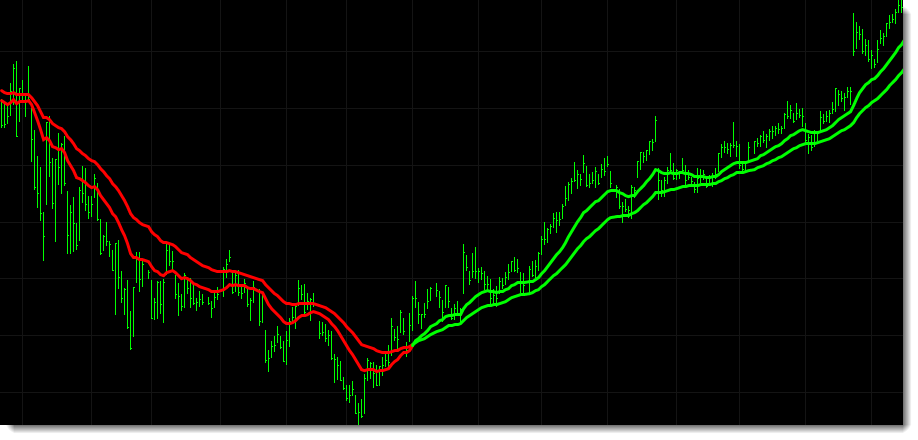
In the MSFT chart below two moving averages are being used to determine the trend of the market. This time the moving average lines change color when the fast moving average crosses the slow moving average instead of when the market itself crosses the moving average.
Should you wish the moving average trend indicator includes the option to change the color of the price bars instead of the moving average lines. You can even remove the moving average lines from the chart completely. The image below is taken from the same MSFT chart as above but with the trend color change applied to the price bars and the moving average lines deactivated.

Another example of using two moving averages together. In this example the 50 day moving average and 200 day moving average are being used to determine the trend of the S&P 500.
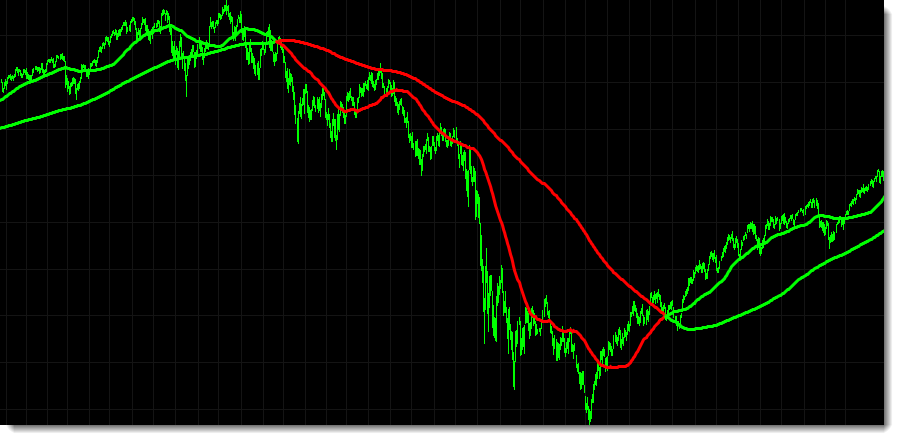
This chart has two moving average trend indicators applied, both of which are comparing the market to a moving average but are independent of each other. While the short term trend alternates between bullish and bearish the long term trend remains in a strong up trend.

Additional Information
The moving average trend indicator includes the same settings found in the regular TradeStation moving average indicators so you can set the price and length of the moving averages you wish to monitor.
When applied to a RadarScreen the moving average trend indicator provides additional information. The indicator also includes the option to change the color of the information displayed in RadarScreen based upon the prevailing trend.
- Fast MA - displays the current value of the fast moving average/price.
- Slow MA - displays the current value of the slow moving average/price.
- % Diff - shows the percentage different between the fast and slow moving averages.
- Crossed - alerts that the fast moving average has crossed the slow moving average by displaying a text message in the column.
- Xover Bars - displays the number of bars since the fast moving average crossed the slow moving average.

The moving average trend indicator applied to a RadarScreen.
Standard Indicator Features
- Various inputs and settings to help customize and optimize each indicator.
- Can be applied within TradeStation using various tools, including charts, RadarScreens and scanner.
- Option to use TradeStation sound, message and email alerts.
- Includes PDF manual.
Delivery
You should expect to receive your order within 1 working day via email.
| 100% Money Back Guarantee These TradeStation compatible indicators come with a 30 day money back guarantee. During the first 30 days after purchasing these indicators you can use and evaluate these indicators as much as you like. If after purchasing these indicators you decide they are not right for you just let us know within 30 days for a full refund. |
||
Continued Support and Updates for a Minimum of 12 Months
All our products include full support and updates for at least 1 year so if you have any problems or require any additional information you can contact us for assistance.
If you have any questions about this, or any other product we offer, please contact us.
Disclaimer
All information provided is for educational purposes only and it should not be assumed that the information presented will be profitable or that it will not result in losses.
You understand and acknowledge that there is a high degree of risk involved in trading securities and/or currencies. TechnicalTradingIndicators.com assume no responsibility or liability for your trading and investment results and you agree not to hold the company liable for any monetary loss and/or damages of any kind. There is a high degree of risk in trading and you should always consult a qualified advisor about the suitability of any investment.
HYPOTHETICAL OR SIMULATED PERFORMANCE RESULTS HAVE CERTAIN LIMITATIONS. UNLIKE AN ACTUAL PERFORMANCE RECORD, SIMULATED RESULTS DO NOT REPRESENT ACTUAL TRADING. ALSO, SINCE THE TRADES HAVE NOT BEEN EXECUTED, THE RESULTS MAY HAVE UNDER-OR-OVER COMPENSATED FOR THE IMPACT, IF ANY, OF CERTAIN MARKET FACTORS, SUCH AS LACK OF LIQUIDITY. SIMULATED TRADING PROGRAMS IN GENERAL ARE ALSO SUBJECT TO THE FACT THAT THEY ARE DESIGNED WITH THE BENEFIT OF HINDSIGHT. NO REPRESENTATION IS BEING MADE THAT ANY ACCOUNT WILL OR IS LIKELY TO ACHIEVE PROFIT OR LOSSES SIMILAR TO THOSE SHOWN
Tradestation Disclaimer:
“Neither TradeStation Technologies nor any of its affiliates has reviewed, certified, endorsed, approved, disapproved or recommended, and neither does or will review, certify, endorse, approve, disapprove or recommend, any trading software tool that is designed to be compatible with the TradeStation Open Platform.”
Read our full disclaimer plus terms and conditions here.
