 Loading... Please wait...
- Home
- Indicators for TradeStation
- Double Top and Double Bottom Indicator Set for TradeStation
The Double Top/Double Bottom indicators are designed to identify double tops and bottoms with TradeStation and then to monitor the market as the pattern progresses.
A double top forms over a number of bars when a market makes a new high and is followed by a measured pullback. Subsequently the market rises again close to the same level as the previous high established prior to the pullback before selling off again, forming a kind of 'M' shape. The reverse is true for a double bottom.
Traders can use our indicators to identify double top and bottom setups as soon as the peaks/valleys of the pattern are formed prior to the neckline being breached, or wait until the market has broken through the neckline before taking action.
Our indicators can be used to identify double tops and double bottoms as they form either on a chart or to scan multiple markets simultaneously with the help of TradeStations RadarScreen or scanner. Once identified traders can then watch the pattern unfold and set alerts if they wish to be notified when the market has broken key levels.
The double top/bottom indicators also provide an opportunity for breakout traders seeking to identify areas of short term resistance as established by the twin pattern peaks and looking to take advantage should the pattern fail and the market reverse.
Included within these indicators are multiple settings for customizing the indicators function and appearance including adjusting the strength of the double top/double bottom pattern detected and when to be alerted to potential trading opportunities.
The indicators can also be inserted into a TradeStation RadarScreen to scan the market and identify double top and double bottom patterns as they setup and then monitor the market as the pattern evolves.
100% Money Back Guarantee
You can try these indicators for 30 days risk free and evaluate them for yourself within TradeStation. If after purchasing these indicators you decide they are not right for you just let us know within 30 days for a full refund.
Screenshots
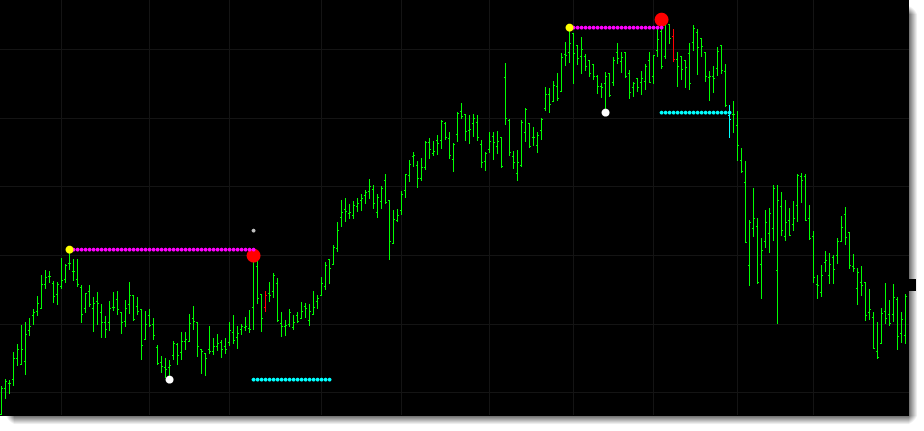
The screenshot below shows the double top pattern identified in a TradeStation chart. The yellow dot identifies the first peak of the double top and the red dot identifies the second peak. The white dot highlights the lowest point between the two peaks. The cyan dots are placed at the neckline.

The NOV chart example below shows a longer term double top identified prior to the market selling off.

The screenshot below is taken from the forex GBPUSD market and shows a double top formation being identified within an intraday chart.

This next chart below shows a double top pattern detected in MSFT. In this example the indicator is set to place the neckline halfway between the valley low (where the original neckline would be) and the high peak of the pattern allowing for traders to be alerted earlier to a potential market reversal.

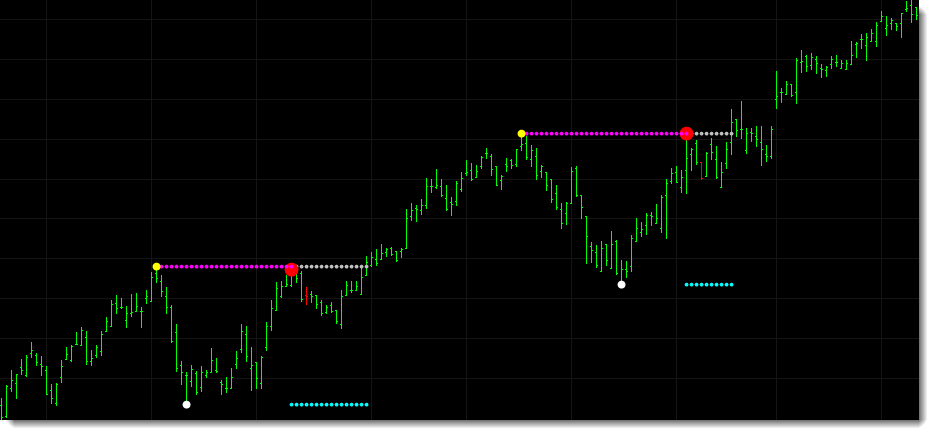
This IFF image below shows two double top patterns detected in close succession. The first potential double top fails to break the neckline and the market moves higher forming a second double top which subsequently does break the neckline and proceeds to sell off.
The double top indicator can also be used as a breakout indicator to identify when markets breakout to new highs through a recent level of resistance. In the DISCK chart below the breakout level is activated as shown by the gray dots and traders can be alerted as the market moves higher through the level of resistance set by the prior peaks of the double top.
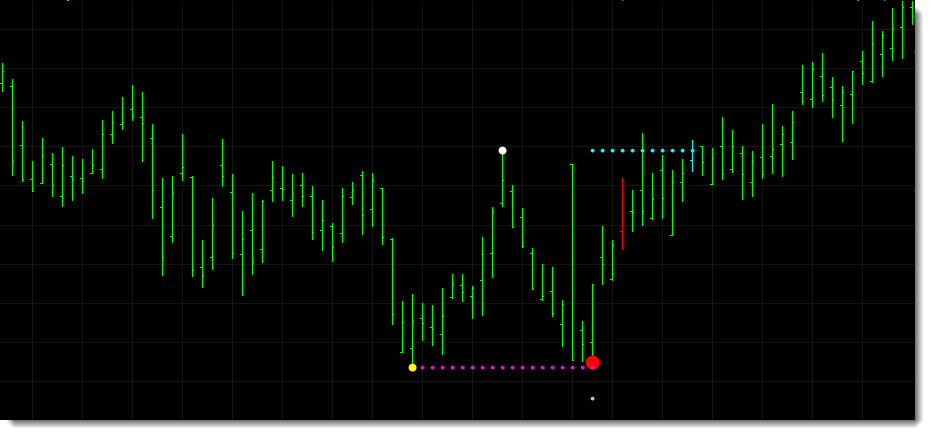
Everything said of the double top indicator is also true of the double bottom indicator, just flipped. Below is a screenshot showing a double bottom pattern detected in AVB.
The next example is from CHD and shows the detection of another double bottom pattern.

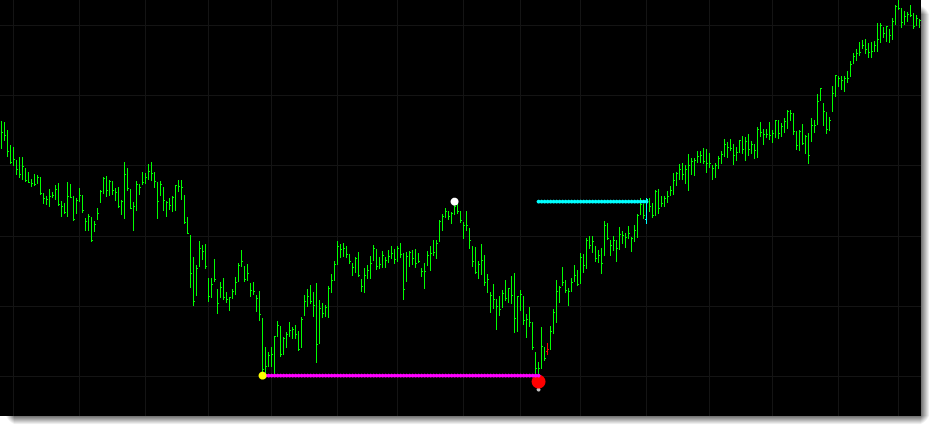
The chart below shows a longer term double bottom detected in DGX before the market starts making new highs.
Additional Information
The double top and double bottom indicators include multiple settings for customizing the indicators like adjusting the strength of the price peaks and the number of bars to be considered when monitoring for double tops. Traders can identify double top and bottom setups when they break through the neckline or alternatively they can be alerted earlier as soon as the two peaks of the double top are formed.
When applied to a RadarScreen the double top and double bottom indicators provide additional information.
- DT-2 - displays the price of the second pivot peak.
- Bars Since DT-2 - shows the number of bars since the second pivot peak.
- Breakout - shows the price at which a breakout alert would be triggered and the double top pattern fail.
- Neckline - displays the neckline price.
- Monitor - calculates where the market is in relation to the neckline and breakout levels. A value of 0 or less means that prices are at or below the neckline while a value of 1 or higher means prices are trading at or above the breakout level.
- Text - displays a text message should the market reach the neckline, a breakout occur or the maximum number of bars permitted is reached.
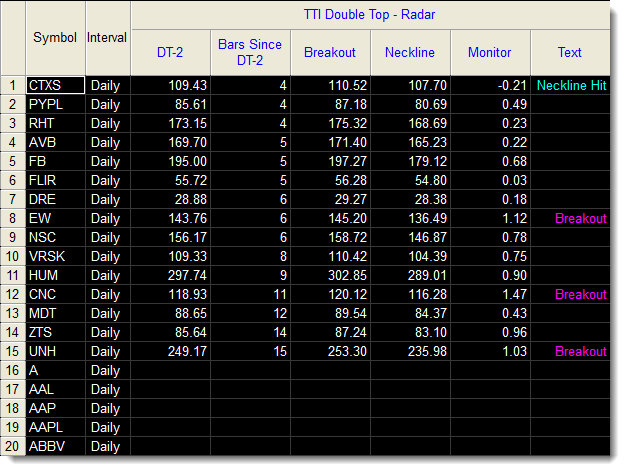
The double top indicator applied to a RadarScreen.
While the primary focus above has been on the double top indicators the double bottom indicators include all the same features.
Standard Indicator Features
- Various inputs and settings to help customize and optimize each indicator.
- Can be applied within TradeStation using various tools, including charts, RadarScreens and scanner.
- Option to use TradeStation sound, message and email alerts.
- Includes PDF manual.
Delivery
You should expect to receive your order within 1 working day via email.
| 100% Money Back Guarantee These TradeStation compatible indicators come with a 30 day money back guarantee. During the first 30 days after purchasing these indicators you can use and evaluate these indicators as much as you like. If after purchasing these indicators you decide they are not right for you just let us know within 30 days for a full refund. |
||
Continued Support and Updates for a Minimum of 12 Months
All our products include full support and updates for at least 1 year so if you have any problems or require any additional information you can contact us for assistance.
If you have any questions about this, or any other product we offer, please contact us.
Disclaimer
All information provided is for educational purposes only and it should not be assumed that the information presented will be profitable or that it will not result in losses.
You understand and acknowledge that there is a high degree of risk involved in trading securities and/or currencies. TechnicalTradingIndicators.com assume no responsibility or liability for your trading and investment results and you agree not to hold the company liable for any monetary loss and/or damages of any kind. There is a high degree of risk in trading and you should always consult a qualified advisor about the suitability of any investment.
HYPOTHETICAL OR SIMULATED PERFORMANCE RESULTS HAVE CERTAIN LIMITATIONS. UNLIKE AN ACTUAL PERFORMANCE RECORD, SIMULATED RESULTS DO NOT REPRESENT ACTUAL TRADING. ALSO, SINCE THE TRADES HAVE NOT BEEN EXECUTED, THE RESULTS MAY HAVE UNDER-OR-OVER COMPENSATED FOR THE IMPACT, IF ANY, OF CERTAIN MARKET FACTORS, SUCH AS LACK OF LIQUIDITY. SIMULATED TRADING PROGRAMS IN GENERAL ARE ALSO SUBJECT TO THE FACT THAT THEY ARE DESIGNED WITH THE BENEFIT OF HINDSIGHT. NO REPRESENTATION IS BEING MADE THAT ANY ACCOUNT WILL OR IS LIKELY TO ACHIEVE PROFIT OR LOSSES SIMILAR TO THOSE SHOWN
Tradestation Disclaimer:
“Neither TradeStation Technologies nor any of its affiliates has reviewed, certified, endorsed, approved, disapproved or recommended, and neither does or will review, certify, endorse, approve, disapprove or recommend, any trading software tool that is designed to be compatible with the TradeStation Open Platform.”
Read our full disclaimer plus terms and conditions here.
