 Loading... Please wait...
- Home
- Indicators for TradeStation
- 83 Candlestick Pattern Indicators for TradeStation
Candlestick patterns are the purest form of technical analysis. Candlestick patterns do not require any complex calculations or additional data, they simply use the four major price point (open, high, low and close) to interpret investor sentiment in anticipation of predicting the future market direction.
The candlestick pattern indicator set includes 83 separate candlestick patterns and is split between 40 major candlestick patterns and 43 advanced candlestick patterns. The major candlestick pattern set includes popular candlestick patterns like the doji and hammer patterns while the advanced candlestick pattern set includes more complex patterns like the three white soldiers or tasuki gap.
You can find two charts below detailing all 83 candlestick patterns available in this indicator set for TradeStation.
Major Candlestick Patterns Indicators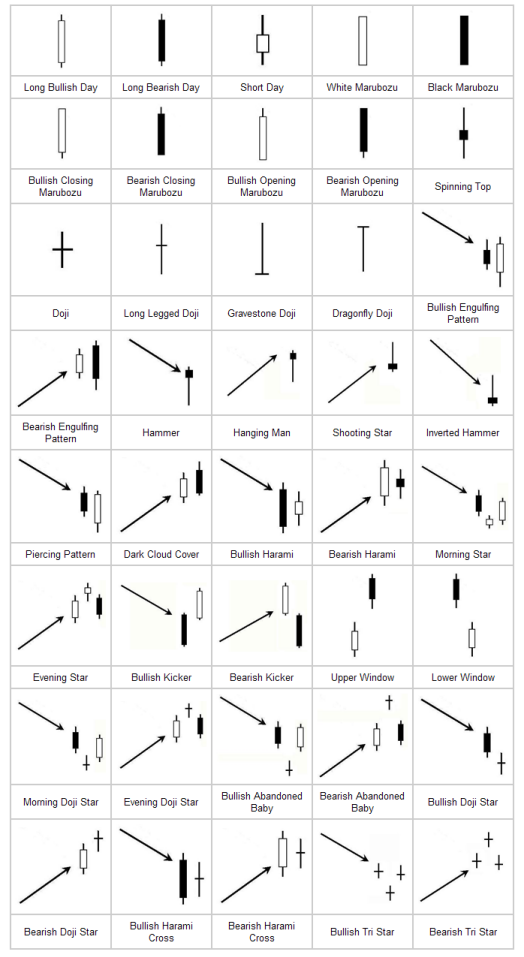
Advanced Candlestick Pattern Indicators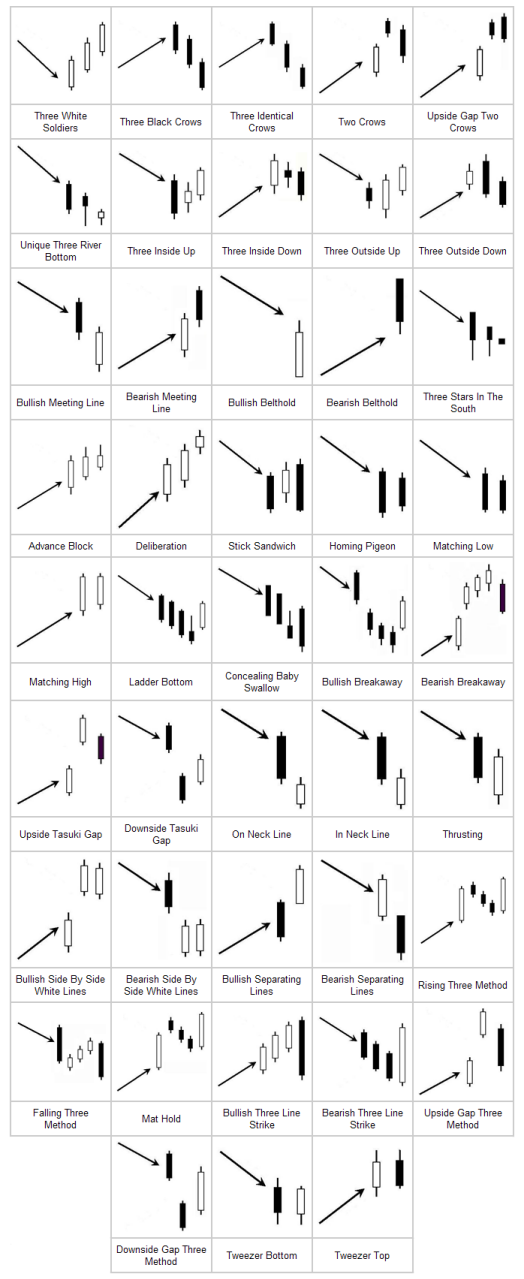
100% Money Back Guarantee
You can try these indicators for 30 days risk free and evaluate them for yourself within TradeStation. If after purchasing these indicators you decide they are not right for you just let us know within 30 days for a full refund.
Screenshots
A chart of AAPL with the long bullish candlestick pattern indicator applied and set to display showme dots above and below the corresponding candle.

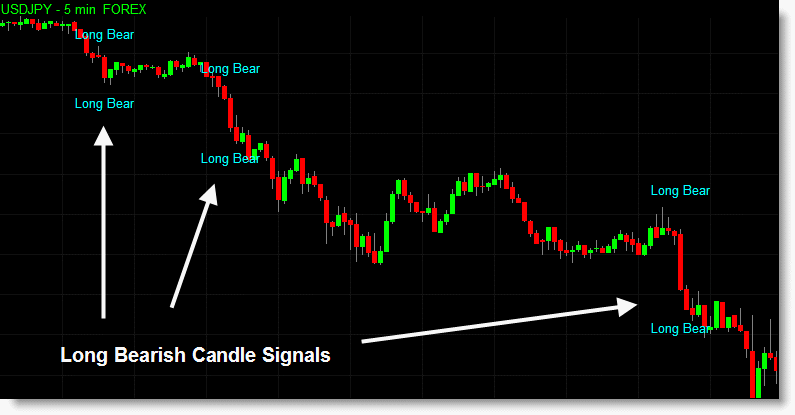
The long bearish candlestick pattern indicator applied to an intraday forex chart and set to display a text message identifying the candlestick pattern around the bar concerned.
The GE chart below contains two different indicators for detecting the doji candlestick pattern. The first displays the name of the candlestick pattern around the doji bar on the chart. The second indicator plots a separate sub-graph identifying the same doji pattern for traders who wish to keep their price charts clear.

Additional Information
Each of the 83 candlestick patterns has its own dedicated set of indicators which contain multiple settings to adjust the parameters of the candlestick pattern in question.
In addition to the candlestick indicators which display showme dots or text on top of a price chart each candlestick indicator is also provided in the form of sub-graph indicator allowing you the option to keep the main price chart clear.
When applied to a RadarScreen the candlestick indicators can scan for multiple patterns in real-time.
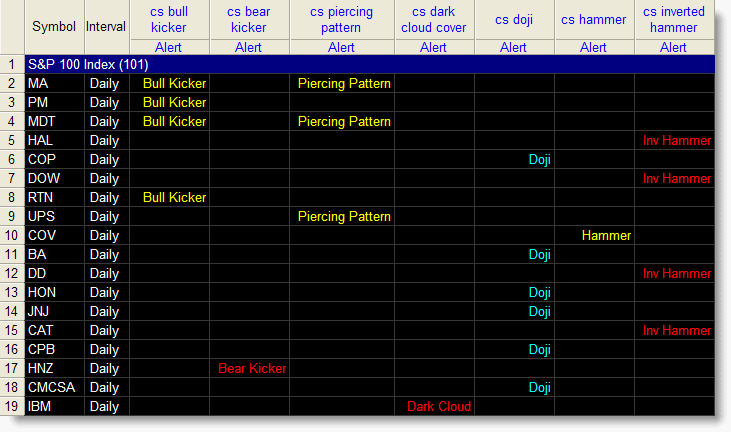
Multiple candlestick indicators applied to a RadarScreen.
Standard Indicator Features
- Various inputs and settings to help customize and optimize each indicator.
- Can be applied within TradeStation using various tools, including charts, RadarScreens and scanner.
- Option to use TradeStation sound, message and email alerts.
- Includes PDF manual.
EasyLanguage Functions for TradeStation
All our indicators are provided in the form of an Easylanguage function. Easylanguage functions allow you to incorporate our indicators as part of your own strategies and indicators within TradeStation.
Delivery
You should expect to receive your order within 1 working day via email.
| 100% Money Back Guarantee These TradeStation compatible indicators come with a 30 day money back guarantee. During the first 30 days after purchasing these indicators you can use and evaluate these indicators as much as you like. If after purchasing these indicators you decide they are not right for you just let us know within 30 days for a full refund. |
||
Continued Support and Updates for a Minimum of 12 Months
All our products include full support and updates for at least 1 year so if you have any problems or require any additional information you can contact us for assistance.
If you have any questions about this, or any other product we offer, please contact us.
Disclaimer
All information provided is for educational purposes only and it should not be assumed that the information presented will be profitable or that it will not result in losses.
You understand and acknowledge that there is a high degree of risk involved in trading securities and/or currencies. TechnicalTradingIndicators.com assume no responsibility or liability for your trading and investment results and you agree not to hold the company liable for any monetary loss and/or damages of any kind. There is a high degree of risk in trading and you should always consult a qualified advisor about the suitability of any investment.
HYPOTHETICAL OR SIMULATED PERFORMANCE RESULTS HAVE CERTAIN LIMITATIONS. UNLIKE AN ACTUAL PERFORMANCE RECORD, SIMULATED RESULTS DO NOT REPRESENT ACTUAL TRADING. ALSO, SINCE THE TRADES HAVE NOT BEEN EXECUTED, THE RESULTS MAY HAVE UNDER-OR-OVER COMPENSATED FOR THE IMPACT, IF ANY, OF CERTAIN MARKET FACTORS, SUCH AS LACK OF LIQUIDITY. SIMULATED TRADING PROGRAMS IN GENERAL ARE ALSO SUBJECT TO THE FACT THAT THEY ARE DESIGNED WITH THE BENEFIT OF HINDSIGHT. NO REPRESENTATION IS BEING MADE THAT ANY ACCOUNT WILL OR IS LIKELY TO ACHIEVE PROFIT OR LOSSES SIMILAR TO THOSE SHOWN
Tradestation Disclaimer:
“Neither TradeStation Technologies nor any of its affiliates has reviewed, certified, endorsed, approved, disapproved or recommended, and neither does or will review, certify, endorse, approve, disapprove or recommend, any trading software tool that is designed to be compatible with the TradeStation Open Platform.”
Read our full disclaimer plus terms and conditions here.
